
Network monitoring software is an essential tool for IT professionals. It enables them to monitor network performance, analyze data, and detect issues before they impact services. These tools provide a comprehensive view of the infrastructure and ensure business continuity with high efficiency.
What Are the Top 10 Network Monitoring Software
Network monitoring software consists of specialized solutions designed to monitor network performance and analyze transmitted data. These programs allow network administrators to detect issues, analyze performance, and ensure service continuity. Below is a list of the top 10 professional network monitoring software:
- Wireshark
- PRTG Network Monitor
- SolarWinds Network Performance Monitor
- Nagios
- Zabbix
- GlassWire
- ManageEngine OpManager
- NetSpot
- OpenNMS
- Cacti
Wireshark Software
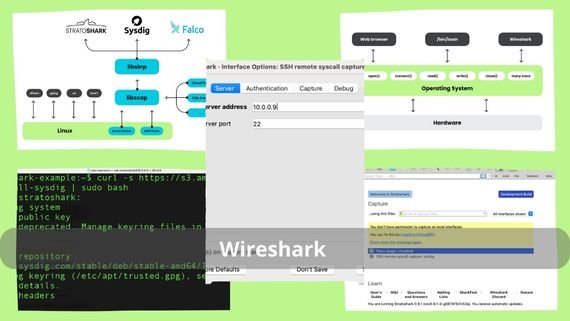
Wireshark is the most popular network protocol analyzer worldwide. It allows users to capture and analyze data with precise detail. It is distinguished by its support for hundreds of protocols and its ability to analyze data in real time, making it the preferred tool for professionals diagnosing network issues. Key features include:
- Detailed network protocol analysis
- Real-time data capture capability
- Support for hundreds of different protocols
- Ability to save captured data for later analysis
- Powerful and user-friendly interface
- Advanced data filtering support
- Creation of detailed reports
Wireshark Installation Steps
To install Wireshark on Windows, follow these steps:
- Download Wireshark 👉 now for free and discover the world of professional network analysis 🔍🚀
- Double-click the installation file to start the setup process on your device.
- Accept the displayed license agreement to proceed to the next step.
- When you reach the component selection screen, keep the default settings to ensure all tools are installed.
- Select any additional options you want, such as creating a desktop icon or associating capture files with the program.
- Choose the appropriate installation path or continue using the system’s default suggested folder.
- When the Npcap installation window appears, make sure to enable installation as it is essential for proper packet capture.
- Click the Install button and wait for the process to complete without interruption.
- After completion, click Finish, then launch Wireshark from the Start menu or desktop icon.
PRTG Network Software
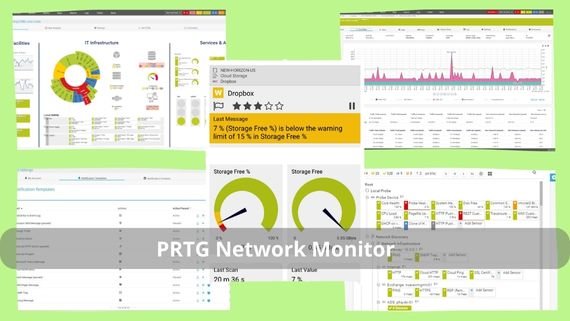
PRTG Network Monitor is a comprehensive network monitoring solution designed to provide full visibility into IT infrastructures. It is known for its ease of use and ability to monitor all aspects of the network through a unified interface, making it ideal for small and medium-sized businesses. Key features include:
- Comprehensive monitoring of IT infrastructures
- Easy-to-use user interface
- Support for monitoring via multiple protocols
- Free version with the option to upgrade to a paid version
Step-by-Step Installation of PRTG Network Monitor
To install PRTG Monitor, follow these steps:
- Download PRTG Network Monitor 👉 now and start monitoring your network professionally 📊🚀
- Select the appropriate Windows version and download it to your device.
- Click the installation file prtg-network-monitor.exe to start the setup process.
- Select your preferred installation language (English or Arabic if available), then click OK.
- When the welcome screen appears, click Next to continue.
- Read the license agreement carefully, then accept it by clicking I Agree.
- At the component selection stage, keep the default settings enabled to install both PRTG Core Server and PRTG Probe together to ensure full functionality.
- Select the appropriate installation folder or continue with the system’s default path.
- Enter the initial login credentials, such as username and password, which will later be used to access the web-based management interface.
- Click Install to begin the installation process and wait until all steps complete automatically.
- After installation, open a web browser and enter the following address to access the program interface: http://localhost/. You can then immediately begin setting up and monitoring the network.
SolarWinds Network Performance Monitor
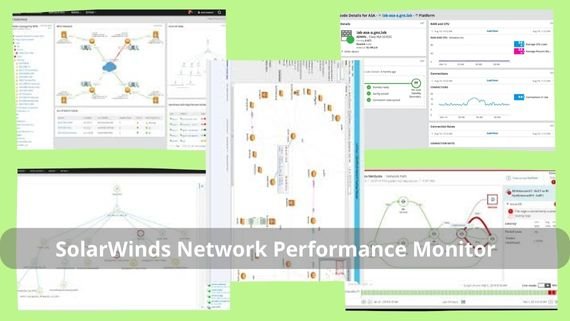
SolarWinds is a comprehensive network performance monitoring tool. It can monitor device status using SNMP and automatically discover devices connected to the network. It is known for its strength and flexibility in handling complex networks, making it the optimal choice for large enterprises. Key features include:
- Comprehensive network performance monitoring
- Automatic discovery of connected devices
- Device monitoring using SNMP
- Design of detailed network reports
SolarWinds Installation Steps
To install SolarWinds Network Performance Monitor, follow these steps:
- 👉 Download SolarWinds Network Performance Monitor now and start monitoring network performance professionally 🚀📊
- After the download completes, double-click the installation file SolarWinds-Orion-Installer.exe to start the setup.
- When the welcome screen appears, click Next to continue.
- From the list of available products, select Network Performance Monitor and proceed.
- Ensure all required prerequisites such as .NET Framework and SQL Server are installed. If not available, the installer will install them automatically.
- Enter the SQL Server connection details, including server name and required login credentials.
- Select the installation folder or use the default path: C:Program Files (x86)SolarWinds
- Enter the service account details under which the program will run. Using a local administrator account is recommended for performance and stability.
- Specify the port for accessing the web interface. You can keep the default port 8787.
- Click Install and wait until all stages are completed.
Nagios Software
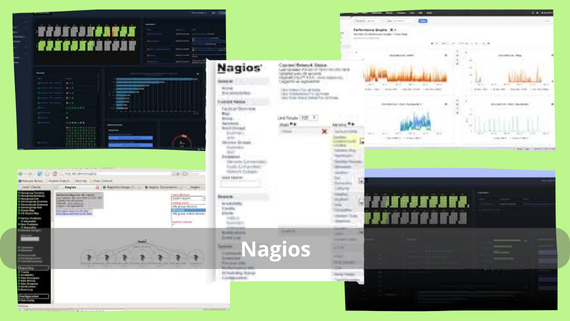
Nagios is a powerful system for monitoring networks and systems. It allows comprehensive monitoring of IT infrastructure and is known for its flexibility and ability to adapt to different environments. Key features include:
- Comprehensive monitoring of networks and systems
- High flexibility across different environments
- Support for device monitoring via SNMP
- Ability to create detailed reports
- Free and open source
- Support for plugins to extend functionality
Nagios Installation Steps
To install Nagios Core on Linux (Ubuntu), follow these steps:
- System Update: Open the terminal and run:
sudo apt update && sudo apt - Install Requirements: Install the required packages:
sudo apt install -y build-essential libgd-dev libssl-dev libapache2-mod-php php-gd php-xml php-mbstring - Download Nagios: Download the latest version from Nagios.
- Extract Files: Extract the files:
tar xzf nagios-4.4.6.tar.gz cd nagios-4.4.6 - Installation: Run the installation commands:
./configure --with-httpd-conf=/etc/apache2/sites-enabled make all sudo make install sudo make install-init sudo make install-commandmode sudo make install-config - Apache Configuration: Copy configuration files:
sudo /usr/bin/install -c -m 644 sample-config/httpd.conf /etc/apache2/sites-enabled/nagios.conf sudo a2enmod rewrite cgi sudo systemctl restart apache2 - Create User Account: Create a login account:
sudo htpasswd -c /usr/local/nagios/etc/htpasswd.users nagiosadmin - Start Service: Start and enable Nagios:
sudo systemctl start nagios sudo systemctl enable nagios - Access the Interface: Open a browser and enter:
http://localhost/nagios.
Zabbix Software

Zabbix is a professional solution for monitoring networks and applications. It enables real-time network performance monitoring and is known for its power and flexibility in large and complex environments, making it ideal for organizations requiring advanced monitoring. Key features include:
- Real-time network performance monitoring
- Support for SNMP device monitoring
- Ability to monitor applications and services
- Free and open source
Zabbix Installation Steps
To install Zabbix on Linux (Ubuntu), follow these steps:
- System Update: Visit Zabbix, download the application, then open the terminal and run:
sudo apt update && sudo apt -y - Add Zabbix Repository: Add the official repository:
wget https://repo.zabbix.com/zabbix/6.0/ubuntu/pool/main/z/zabbix-release/zabbix-release_6.0-1+ubuntu20.04_all.deb sudo dpkg -i zabbix-release_6.0-1+ubuntu20.04_all.deb sudo apt update - Install Server: Install Zabbix packages:
sudo apt install -y zabbix-server-mysql zabbix-frontend-php zabbix-apache-conf zabbix-sql-scripts zabbix-agent - Create Database: Create a database and user for Zabbix:
sudo mysql -uroot -p CREATE DATABASE zabbix CHARACTER SET utf8mb4 COLLATE utf8mb4_bin; CREATE USER zabbix@localhost IDENTIFIED BY 'password'; GRANT ALL PRIVILEGES ON zabbix.* TO zabbix@localhost; quit; - Import Data: Import the initial data:
zcat /usr/share/zabbix-sql-scripts/mysql/server.sql.gz | mysql -uzabbix -p zabbix - Server Configuration: Edit the configuration file:
sudo nano /etc/zabbix/zabbix_server.confAdd the following line, replacing
passwordwith the actual password:DBPassword=password - Start Services: Start and enable Zabbix:
sudo systemctl restart zabbix-server zabbix-agent apache2 sudo systemctl enable zabbix-server zabbix-agent apache2 - Access the Interface: Open a browser and enter:
http://localhost/zabbix.
GlassWire Software

GlassWire is a modern personal firewall and network monitor. It combines firewall functions with network monitoring in an easy-to-use interface. It stands out for its visual traffic monitoring, making it ideal for both regular users and professionals. Key features include:
- Integrated personal firewall and network monitor
- Visual and user-friendly interface
- Visual monitoring of network traffic
- Instant alerts for unusual activity
- Ability to block suspicious applications
- Free version with an option to upgrade
- Easy to use and install
GlassWire Installation Steps
To install GlassWire on Windows, follow these steps:
- 👉 Download GlassWire now and start protecting and analyzing your network easily 🔒📈
- Open the installation file GlassWireSetup.exe after the download completes.
- Read the terms of use carefully, then click I Agree to proceed.
- On the components screen, keep the recommended settings to ensure all essential features are installed.
- Select the installation folder or use the default path C:Program FilesGlassWire.
- Click Install and wait until the installation finishes.
- GlassWire will start automatically.
- You can monitor network activity and data traffic directly from the system tray without additional setup.
ManageEngine OpManager Software

ManageEngine is a comprehensive solution for network monitoring and management. It allows monitoring of network performance and connected devices. It is known for its strength and ease of use in managing medium and large networks, making it a preferred choice for companies seeking an integrated solution. Key features include:
- Comprehensive monitoring of networks and devices
- Automatic device discovery
- Support for SNMP device monitoring
- Ability to create interactive network maps
- Ability to create detailed reports
ManageEngine Installation Steps
To install ManageEngine OpManager, follow these steps:
- Download ManageEngine OpManager 👉 now and start monitoring your network professionally 🌐🚀
- Double-click the installation file ManageEngine_OpManager.exe to start the process.
- Click Next to continue.
- Click I Agree.
- Leave the default component settings to ensure all required tools are installed.
- Select the appropriate installation folder or use the default path: C:Program FilesManageEngineOpManager
- Select the database type, either embedded MySQL or an external server, then enter the initial login credentials.
- Open a browser and enter the following address to access the interface:
http://localhost:8060
NetSpot Software
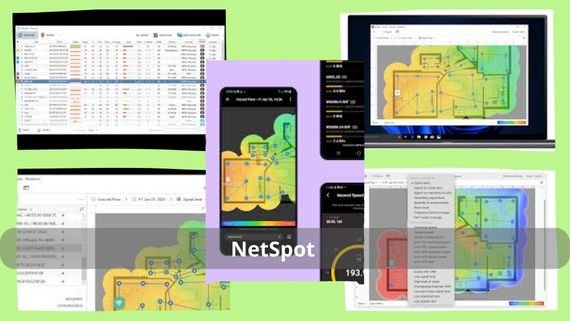
NetSpot is a professional solution for monitoring and analyzing Wi-Fi networks. It allows users to analyze Wi-Fi networks and improve their performance. It features an easy-to-use interface, even for non-experienced users, making it ideal for improving wireless coverage. Key features include:
- Professional Wi-Fi network analysis
- User-friendly interface
- Ability to create network coverage maps
- Support for signal strength and interference analysis
- Ability to detect congested channels
NetSpot Installation Steps
To install NetSpot on Windows, follow these steps:
- Download NetSpot 👉 now and start analyzing Wi-Fi networks easily and professionally 📶🚀
- After the download finishes, double-click the installation file NetSpot.exe to start setup.
- Review the license agreement and accept it by clicking I Agree.
- When the component selection screen appears, keep the default settings.
- Select the appropriate installation folder or use the system’s default path.
- Click Install.
- Open NetSpot from the Start menu and begin scanning and analyzing Wi-Fi networks efficiently.
OpenNMS Software

OpenNMS is a powerful system for network monitoring and management. It is free and open source with advanced capabilities, making it an optimal choice for organizations seeking a customizable solution. Key features include:
- Comprehensive monitoring of networks and systems
- Device monitoring using SNMP
- Support for creating detailed reports
- Powerful user interface
OpenNMS Installation Steps
To install OpenNMS on Linux (Ubuntu), download OpenNMS and follow these steps:
- Download OpenNMS 👉 now and start monitoring your network professionally 🔍🐧
- Open the terminal and update the system to ensure the latest packages are installed:
sudo apt update && sudo apt -y
- Add the official OpenNMS repository and import its key:
echo "deb https://debian.opennms.org stable main" | sudo tee /etc/apt/sources.list.d/opennms.list
wget -O - https://debian.opennms.org/OPENNMS-GPG-KEY | sudo apt-key add -
sudo apt update
- Install OpenNMS:
sudo apt install -y opennms
- Run the setup tool to configure the database and link core components automatically:
sudo /usr/share/opennms/bin/install -dis
- Start the service and enable it at system startup:
sudo systemctl start opennms
sudo systemctl enable opennms
- Open a web browser and go to:
http://localhost:8980/opennms
to access the OpenNMS interface and complete the initial setup.
Cacti Software

Cacti is a network monitoring solution based on graphs. It allows users to create detailed graphs of network performance. It is known for providing a visual view of network performance, making it the preferred choice for professionals who need visual reports. Key features of Cacti include:
- Creation of detailed network performance graphs
- Ability to create detailed reports
- Web-based user interface
- Support for instant alerts when issues occur
- Compatible with various operating systems
- Free and open source
- Continuous updates
- Strong community support
- Full customization capability
Cacti Installation Steps
To install Cacti on Linux (Ubuntu), download the software from Cacti and follow these steps:
- 👉 Download Cacti now and start monitoring the network on Linux professionally 📈🐧, then move to the Ubuntu server.
- Open the terminal and update the system to ensure the latest packages are installed:
sudo apt update && sudo apt upgrade
- Install all required dependencies for Cacti to function properly:
sudo apt install -y apache2 mysql-server php php-mysql php-snmp php-xml php-ldap php-gd php-mbstring php-gmp php-rrd
- Create a database and a dedicated user for Cacti by logging into MySQL:
sudo mysql -uroot -p
Then run the following commands:
CREATE DATABASE cacti;
CREATE USER cacti@localhost IDENTIFIED BY 'password';
GRANT ALL PRIVILEGES ON cacti.* TO cacti@localhost;
FLUSH PRIVILEGES;
quit;
- Download the latest version of Cacti, extract it, and move it to the web directory:
wget https://www.cacti.net/downloads/cacti-latest.tar.gz
tar xzf cacti-latest.tar.gz
sudo mv cacti-* /var/www/html/cacti
- Import the default Cacti database:
sudo mysql -ucacti -p cacti < /var/www/html/cacti/cacti.sql
- Edit the program configuration file:
sudo nano /var/www/html/cacti/include/config.php
- Ensure the database connection settings are configured as follows:
$database_type     = 'mysql';
$database_default  = 'cacti';
$database_hostname = 'localhost';
$database_username = 'cacti';
$database_password = 'password';
- Change folder permissions to ensure Cacti runs without issues:
sudo chown -R www-data:www-data /var/www/html/cacti/
sudo chmod -R 755 /var/www/html/cacti/
- Add a scheduled task (Cron Job) to run the data collection tool automatically:
sudo crontab -e
Then add the following line:
*/5 * * * * php /var/www/html/cacti/poller.php > /dev/null 2>&1
- Open a web browser and enter the following address to complete the Cacti setup through the graphical interface:
http://localhost/cacti
Cacti has now been successfully installed and configured, and you can immediately begin monitoring the network and viewing graphs with ease.
Network Monitoring Software Comparison
Choosing the right network monitoring software depends on several factors such as network size, available budget, and the user’s technical level. Some programs focus on simplicity and ease of use, while others provide advanced solutions for professionals. Below is a simplified comparison of the top 10 network monitoring software to help you make the right decision:
| Software Name | Features | Disadvantages |
|---|---|---|
| Wireshark | Advanced protocol analysis, free, supports hundreds of protocols | Complex interface for beginners, requires technical expertise |
| PRTG Network Monitor | Easy to use, comprehensive monitoring, free version | Limited free version, upgrade required for advanced features |
| SolarWinds Network Performance Monitor | Powerful, comprehensive monitoring, automatic discovery | High cost, requires high system resources |
| Nagios | Free, open source, flexible | Requires high technical expertise, difficult initial setup |
| Zabbix | Free, powerful, real-time monitoring | Requires high technical expertise, complex configuration |
| GlassWire | Visual interface, easy to use, integrated firewall | Limited advanced features, not suitable for large networks |
| ManageEngine OpManager | Comprehensive, easy to use, good technical support | High cost, some features require additional licenses |
| NetSpot | Wi-Fi focused, easy to use | Limited wired network monitoring, limited free version |
| OpenNMS | Free, open source, powerful | Requires high technical expertise, outdated user interface |
| Cacti | Free, detailed graphs | Somewhat outdated interface, requires configuration experience |
Network monitoring software offers diverse solutions suitable for all needs, from beginners to professionals. Choosing the right software ensures network continuity, early issue detection, and efficient improvement of IT infrastructure performance.