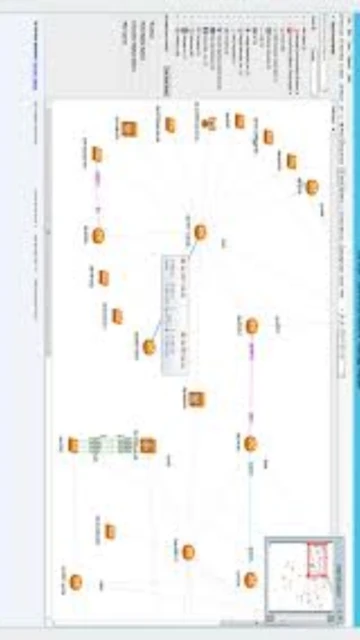
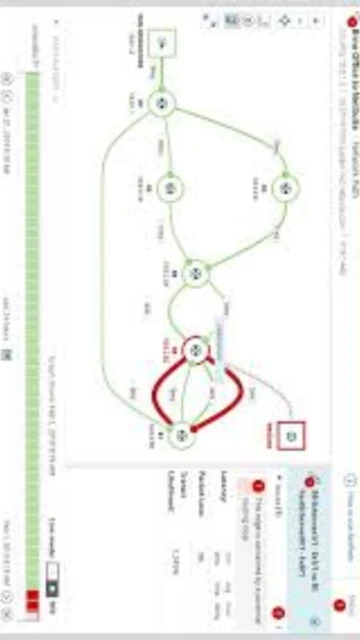
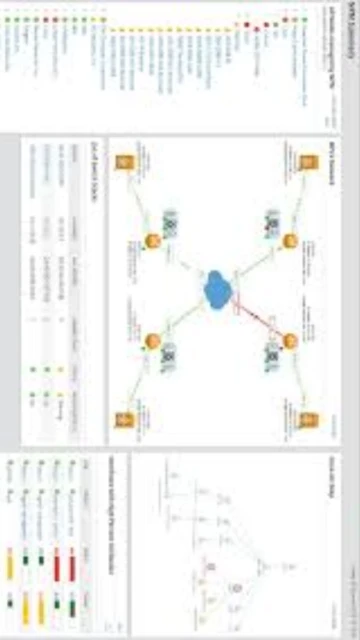
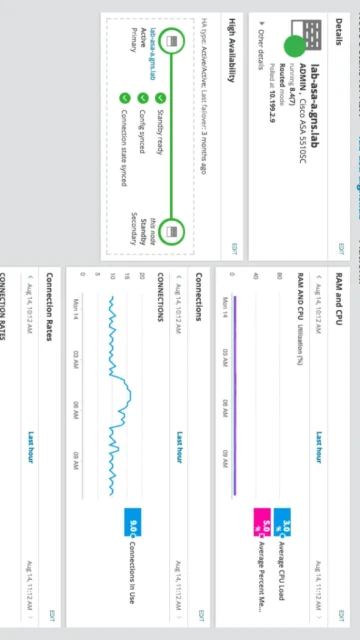
SolarWinds Network Performance Monitor (NPM) stands as the leading SNMP-based network monitoring platform for enterprises managing complex, multi-vendor environments. Now part of SolarWinds Observability Self-Hosted 2025.4, NPM delivers unmatched visibility across on-premises and hybrid networks with intelligent topology mapping, NetFlow analysis, and predictive alerting powered by AIOps. This guide covers installation, configuration, target users, and optimization strategies for maximizing your network monitoring investment.
How to Install SolarWinds Network Performance Monitor
SolarWinds NPM requires enterprise-grade infrastructure planning and methodical deployment. The installation wizard simplifies configuration, but proper sizing ensures optimal performance across thousands of monitored elements. SolarWinds provides a 30-day free trial for evaluation before production deployment.
- Download from SolarWinds Official – Visit the official SolarWinds website and download NPM 2025.4.1, the latest release as of October 21, 2025. Create a SolarWinds account and obtain the license key for your deployment tier.
- Prepare Infrastructure – Allocate dedicated Windows Server 2019 or 2022 (64-bit) with minimum 8GB RAM for small deployments, or 32GB+ for large environments. Ensure SQL Server 2019 or newer is installed separately with appropriate collation settings.
- Run Installation Wizard – Execute the installer on your prepared server. The Configuration Wizard guides you through network discovery parameters, SNMP credentials, and polling engine setup. Specify your database server location and credentials during this phase.
- Complete Initial Setup – Access the web console via HTTPS on port 443, configure autodiscovery ranges, import device templates, and verify initial polling status. Test SNMP connectivity to critical network devices before enabling production alerting.
Who Should Use SolarWinds Network Performance Monitor
NPM targets enterprise IT teams and managed service providers managing thousands of network devices across distributed locations. Its depth of SNMP analytics and professional reporting make it ideal for organizations prioritizing network reliability and requiring regulatory compliance documentation. Smaller businesses with simple networks may find the complexity and cost excessive.
- Enterprise Network Engineers – Monitor global networks with 5,000+ devices and require real-time performance visibility, capacity planning, and detailed SLA reporting across multiple locations.
- Managed Service Providers (MSPs) – Manage client networks with white-label dashboards, multi-tenant capabilities, and consolidated alerting across dozens of customer environments simultaneously.
- Network Operations Centers (NOCs) – Maintain 24/7 uptime for mission-critical infrastructure with dependency-aware alerting, automatic failover detection, and comprehensive historical analytics.
- NOT ideal for – Cloud-native DevOps teams prioritizing container monitoring, budget-constrained small businesses, or organizations requiring extensive API-first architectures rather than SNMP polling.
SolarWinds Network Performance Monitor Platform Compatibility
SolarWinds NPM runs on the SolarWinds Platform 2025.4 and operates across Windows Server and Linux environments. Platform-specific features include native WMI polling on Windows and enhanced SSH support on Linux, with web-based console access from any modern browser regardless of host OS.
| Platform |
Min. Version |
Unique Features |
Limitations |
| Windows Server |
2019 64-bit (minimum 8GB RAM small, 32GB large) |
Native WMI polling, Hyper-V monitoring integration, IIS-based web console, Active Directory authentication |
Requires SQL Server co-installation; desktop editions supported only for evaluation |
| Linux |
RHEL 8+, Ubuntu 20.04+, CentOS 8+ (minimum 8GB RAM) |
Enhanced SSH support, systemd integration, native database tools, lightweight footprint |
Limited WMI capabilities; requires external SQL Server or separate database host |
| Web Console |
Chrome, Firefox, Safari, Edge (latest 2 versions) |
Cloud-hosted option available via Azure/AWS, responsive design for tablets, real-time dashboard synchronization |
JavaScript required; Internet Explorer not supported; performance depends on client system |
| Database |
SQL Server 2019+ Standard/Enterprise (separate host required) |
High availability with SQL Always-On, RAID optimization, Gregorian calendar localization only |
Azure SQL Database compatibility limited; German and Japanese language support only |
SolarWinds Network Performance Monitor Integrations & Plugins
NPM integrates with the broader SolarWinds ecosystem and external platforms via SWIS REST API and webhook support. Integrations enable alert routing, automated remediation, and consolidated reporting across monitoring, ticketing, and ITSM platforms, extending NPM’s capabilities beyond network-only visibility.
- Freshservice Alert Integration – Route SolarWinds NPM alerts into Freshservice’s enriched alert aggregation, creating tickets automatically for network incidents and enabling cross-team visibility for faster resolution.
- SolarWinds Server & Application Monitor (SAM) – Correlate network performance with application performance; identify whether slowdowns originate from network or application layers for targeted troubleshooting.
- Network Traffic Analyzer (NTA) – Enhance NPM interface monitoring with full-packet flow analysis; drill down from interface saturation alerts into application-level traffic patterns.
- Configuration Management (NCM) – Automatically capture device configurations during performance events; enable configuration rollback during incidents for rapid recovery without manual intervention.
Best Alternatives to SolarWinds Network Performance Monitor
While SolarWinds NPM dominates enterprise SNMP monitoring, alternatives offer lower costs, superior cloud integration, or open-source flexibility. Organizations evaluating SolarWinds should consider these competitors for different use cases, budgets, and architectural preferences aligned with their long-term monitoring strategies.
- ManageEngine OpManager – Best for mid-market cost consciousness and modular licensing, offering unified network, server, and application monitoring without mandatory bundling or three-year subscription commitments SolarWinds now enforces.
- PRTG Network Monitor – Best for simplified deployment and all-inclusive sensor-based monitoring without complex setup; offers unlimited distributed probes and clear subscription pricing with no hidden node charges.
- Nagios XI – Best for highly customizable open-source monitoring with extensive plugin ecosystem; preferred by organizations requiring complete configuration control and minimal vendor lock-in despite steeper learning curves.
- Datadog – Best for cloud-native environments and comprehensive observability combining infrastructure, APM, and logs; provides superior cloud integration and AI-powered insights for modern distributed systems.
SolarWinds Network Performance Monitor vs Top Competitors
SolarWinds NPM excels in mature SNMP capabilities and multi-vendor device support but faces competition from cloud-native platforms and cost-conscious alternatives. The following comparison highlights key differentiators: licensing model, deployment philosophy, and target customer profiles shaping buying decisions.
| Feature |
SolarWinds NPM |
ManageEngine OpManager |
PRTG Network Monitor |
| Pricing Model |
Subscription-only (3-year minimum, $200-500+ per node annually as of 2025) |
Perpetual licensing available; modular add-ons separate from base platform |
Subscription or perpetual; unlimited sensors from single license tier |
| Key Strength |
Enterprise-grade SNMP analytics, NetFlow integration, intelligent topology mapping |
Unified monitoring (network, server, app) without forced bundling; cost transparency |
Simplicity and all-inclusive approach; no surprise node charge escalation |
| Target Users |
Large enterprises with 5,000+ devices, MSPs, compliance-heavy industries |
Mid-market businesses seeking balanced features and predictable costs |
Organizations preferring straightforward deployment without complex configuration |
| Unique Feature |
NetPath visualization, PerfStack correlation, AIOps-powered anomaly detection |
IP Address Manager, Switch Port Mapper, integrated configuration management |
Unlimited distributed probes, immediate sensor scalability, transparent pricing guarantee |
| Learning Curve |
Steep (requires SNMP expertise, network protocol knowledge) |
Moderate (intuitive UI but feature-rich) |
Easy (sensor-based approach requires minimal networking knowledge) |
SolarWinds Network Performance Monitor Keyboard Shortcuts
The NPM web console provides keyboard shortcuts for power users managing large network deployments. Shortcuts accelerate navigation between dashboards, reduce mouse dependency, and improve efficiency during incident response when every second counts for network restoration.
| Action |
Windows/Linux |
macOS |
| Search Devices |
Ctrl+F |
Cmd+F |
| Open Dashboard |
Ctrl+D |
Cmd+D |
| Refresh Current View |
Ctrl+R |
Cmd+R |
| View Alerts Summary |
Ctrl+Shift+A |
Cmd+Shift+A |
| Create New Map |
Ctrl+M |
Cmd+M |
| Export Current Report |
Ctrl+E |
Cmd+E |
SolarWinds Network Performance Monitor Performance Optimization
Optimizing NPM improves response times, reduces database load, and maximizes monitoring scalability. Configuration tuning, polling interval adjustments, and resource allocation prevent performance degradation as monitored device counts grow toward licensing limits.
- Adjust SNMP Polling Intervals – Increase polling intervals for non-critical interfaces from 30 to 60 seconds; reduces database I/O by 50% while maintaining near-real-time visibility for most network monitoring scenarios.
- Enable Polling Engine Distribution – Deploy additional polling engines for environments exceeding 12,000 elements; distributes SNMP load across multiple cores and prevents single-point CPU saturation.
- Optimize Database Indexes – Run SQL Server maintenance tasks nightly; rebuild fragmented indexes reducing query execution time by 30-40% especially for historical data reports.
- Implement Data Retention Policies – Configure automatic archival of data older than 24 months; reduces active database size and improves query performance for real-time dashboard loads.
- Monitor Memory and Disk I/O – Use Windows Performance Monitor or Linux iostat to track polling engine resource utilization; scale hardware before hitting 80% thresholds.
SolarWinds Network Performance Monitor Accessibility Features
SolarWinds demonstrates commitment to accessible monitoring for users with disabilities. The web console supports keyboard-only navigation, high-contrast modes, and screen reader compatibility, enabling diverse team members to monitor critical infrastructure.
- Screen Reader Support – NVDA and JAWS compatible; interface uses semantic HTML and ARIA labels allowing blind users to navigate dashboards and configure alerts independently.
- Visual Accessibility – High contrast themes available; font scaling up to 200% supported; color-blind modes distinguish alerts by shape and icon in addition to color coding.
- Motor Accessibility – Full keyboard navigation supported; no mouse-only functions; tab order optimized for rapid interface traversal; customizable keyboard shortcuts for frequent actions.
- Localization – UI available in German and Japanese only; limited RTL (right-to-left) support; Gregorian calendar constraint affects non-Western users with different calendar systems.
SolarWinds Network Performance Monitor Support & Documentation
SolarWinds provides multi-channel support including extensive documentation, community forums, video tutorials, and professional services. Support quality varies by subscription tier, with enterprise contracts offering dedicated technical account managers and priority escalation.
- Official Documentation – Comprehensive product guides covering installation, configuration, and troubleshooting; release notes for each version; system requirements documentation maintained in real-time for latest versions.
- Community Forums (THWACK) – Active user community sharing configuration best practices, custom reports, and solutions for common implementation challenges; moderated by SolarWinds technical experts.
- Video Tutorials – SolarWinds YouTube channel contains recorded webinars on NPM configuration, NetFlow analysis, and integration scenarios; on-demand training available through SolarWinds University.
- Contact Support – Enterprise customers receive 24/7 technical support via email and online ticketing; typical response times 1-2 business days; premium support offers phone access and live chat during business hours.
