PRTG Network Monitor represents an industry-leading infrastructure monitoring solution trusted by 500,000 users worldwide for centralized visibility across IT networks, cloud environments, and operational infrastructure. This comprehensive guide explores PRTG’s capabilities for real-time network monitoring, server health tracking, application performance analysis, and proactive alerting. Readers will discover installation procedures, sensor configuration, integration possibilities, performance optimization, and competitive differentiation in enterprise monitoring landscapes.
How to Install PRTG Network Monitor
PRTG installation involves deploying a core server component managing monitoring infrastructure and optionally adding remote probes for distributed monitoring across geographically dispersed networks. The process requires Windows Server infrastructure and .NET Framework installation.
- Verify System Requirements – Ensure Windows Server 2016 or later (or Windows 10/11 for non-production), .NET Framework 4.7.2+ installed, administrator access, and appropriate hardware (minimum 4GB RAM and 100GB disk for 500 sensors). Allocate additional resources based on your monitoring scale.
- Download Installer – Obtain PRTG version 25.4.114 from Paessler official website, activate a free 30-day trial (full features, unlimited sensors), or apply existing license key. Verify checksum for security integrity before proceeding.
- Run Installation Wizard – Execute the 324MB installer with administrator privileges, accepting PRTG license agreement and selecting installation directory. Choose whether to install core server or remote probe component based on deployment architecture and monitoring requirements.
- Configure Network Access – After installation, access PRTG web interface via https://localhost:8084 (default), log in with credentials, configure Windows Firewall rules for monitoring traffic, and optionally set up SSL certificates for production deployments.
Who Should Use PRTG Network Monitor
PRTG serves IT departments requiring centralized monitoring across networks, servers, cloud services, and applications. Organizations from small businesses (100-sensor free edition) to enterprises deploy PRTG for infrastructure visibility, performance optimization, and compliance reporting.
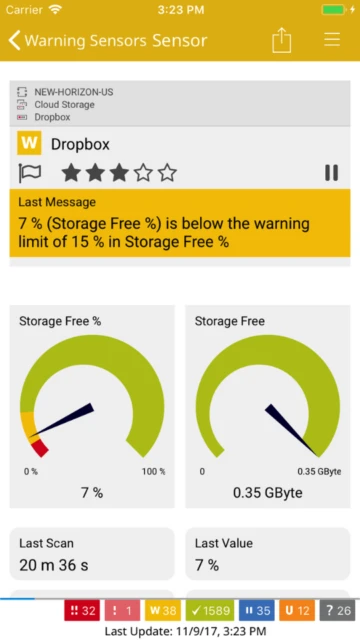
- IT Operations Teams – Monitor network infrastructure, server health, application performance, and cloud resources from unified dashboard. Receive proactive alerts enabling rapid issue resolution before end-user impact occurs.
- Network Engineers – Track bandwidth usage patterns, identify bottlenecks, optimize network capacity planning, and validate network changes through real-time monitoring with customizable thresholds and trend analysis.
- System Administrators – Oversee Windows/Linux servers, database performance, virtual machine resource allocation, and service availability across distributed infrastructure with automated discovery and predefined device templates.
- NOT ideal for – Passive network packet analysis requiring deep protocol inspection, organizations exclusively using Linux/macOS (Windows Server required), or teams needing advanced behavioral threat detection beyond metrics-based monitoring.
PRTG Network Monitor Platform Compatibility
PRTG core server requires Windows Server infrastructure, though multi-platform probes support Linux, BSD, and embedded systems for distributed monitoring. Cloud-hosted PRTG option available for teams avoiding on-premises server deployment.
| Platform |
Min. Version |
Unique Features |
Limitations |
| Windows |
Windows Server 2016 or Windows 10/11 |
Native WMI monitoring, PowerShell integration, Active Directory authentication, native Windows Event Log collection, VMware and Hyper-V integration |
Core server Windows-only; no native Linux server implementation; requires .NET Framework installation |
| Multi-Platform Probe |
Linux 4.4+, BSD, embedded systems |
Deploy probes on Linux servers, IoT devices, and resource-constrained systems for decentralized monitoring; reduced PRTG core server load with distributed architecture |
Multi-platform probes support SNMP and basic sensors only; advanced sensors require Windows probe |
| Cloud (Hosted) |
Browser-based access |
Paessler-managed infrastructure, no on-premises server required, automatic updates, zero server maintenance, pay-per-sensor cloud pricing model |
Limited to 10,000 sensors maximum per cloud instance; potential latency for geographically distant networks; data sovereignty concerns |
| Web Interface |
HTML5 browsers (Chrome, Edge, Firefox) |
Responsive design supporting desktop and mobile access, new API v2 interface, modern AJAX-based dashboard interactions, single sign-on (SSO) integration |
Legacy classic UI requires IE compatibility; new UI still experimental in some advanced features |
PRTG Network Monitor Integrations & Plugins
PRTG integrates with enterprise platforms through webhooks, APIs, and native connectors, enabling alerts in Slack/Teams, data export to SIEM systems, Grafana visualization, and custom sensor development for specialized monitoring needs.
- Slack and Microsoft Teams Integration – Configure incoming webhooks for immediate notifications when sensors exceed thresholds. Automated alerts route to specific channels based on device type, severity, or team assignment for rapid response.
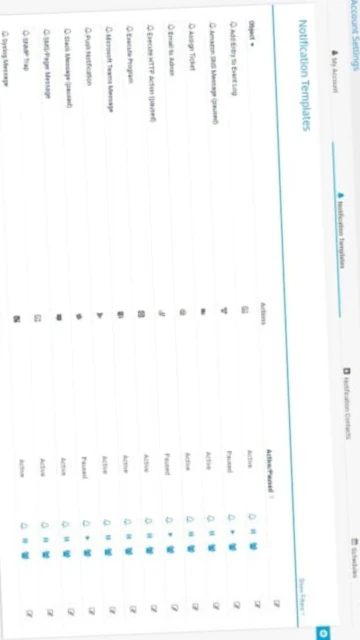
- Email and SMTP Notifications – Send detailed alert reports via integrated email server with html formatting, alert severity icons, and historical context. Custom notification templates enable branded alert messages aligned with internal processes.
- Grafana Visualization – Export PRTG metrics to Grafana dashboards for unified observability alongside application metrics and logs. API integration enables real-time data synchronization and cross-platform alerting strategies.
- Custom Sensor Scripts – Develop EXE/Script v2 sensors using PowerShell, Python, or batch scripts for specialized monitoring requirements. HTTP API enables creation of advanced monitoring without native sensor types.
- SIEM Integration – Forward security-relevant alerts to SumoLogic, Splunk, or on-premises SIEM platforms. Audit logging provides compliance audit trails for regulatory requirements (HIPAA, SOC 2, ISO 27001).
Best Alternatives to PRTG Network Monitor
Competing monitoring platforms offer varying advantages: Zabbix and Nagios provide free alternatives with unlimited sensors, SolarWinds delivers advanced enterprise features, Datadog suits cloud-native environments, while LibreNMS offers open-source auto-discovery capabilities.
- Zabbix – Best for organizations requiring unlimited free sensors, cross-platform agents (Windows/Linux), powerful built-in alerting, and enterprise scalability without licensing constraints.
- SolarWinds NPM – Best for large enterprises needing advanced network topology discovery, bandwidth forecasting, application performance monitoring, and comprehensive vendor support infrastructure.
- Datadog – Best for cloud-native organizations monitoring containerized workloads, microservices, and distributed applications with unified observability across infrastructure, logs, and synthetics.
- LibreNMS – Best for open-source deployments valuing automatic network discovery, zero licensing costs, active community development, and network device inventory management.
PRTG Network Monitor vs Top Competitors
PRTG balances comprehensive features, user-friendly interface, and transparent pricing against specialized competitors. Enterprise requirements drive selection between PRTG’s ease-of-use, Zabbix’s unlimited scalability, and SolarWinds’ advanced analytics.
| Feature |
PRTG Network Monitor |
Zabbix |
SolarWinds NPM |
| Pricing |
Freemium: 100 sensors free; €1,649-€10,899/year subscription |
Free, open-source with optional commercial support |
Proprietary enterprise licensing; quote-based pricing |
| Key Strength |
User-friendly interface, automated discovery, 30-day unlimited trial |
Unlimited sensors at zero cost, cross-platform support |
Advanced network topology, application performance mapping, forecasting |
| Target Users |
Mid-market IT operations, managed service providers, growing enterprises |
Enterprise DevOps, cost-conscious organizations, complex infrastructure |
Fortune 500 enterprises, financial institutions, mission-critical networks |
| Unique Feature |
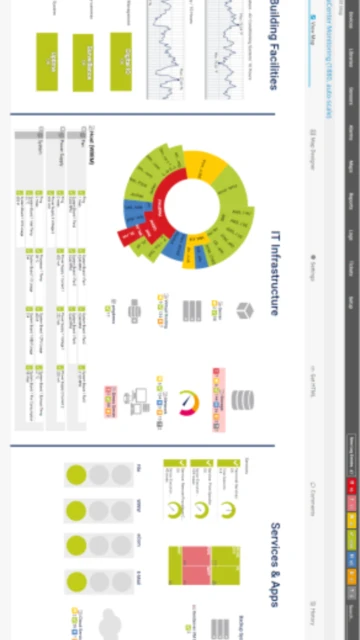
Customizable maps with HTML/drag-drop interface, mobile app support |
Custom metrics and agent flexibility, Lua-based automation |
Network modeling and capacity planning, NetFlow analysis excellence |
| Learning Curve |
Easy – Guided setup wizard, auto-discovery reduces configuration |
Steep – Configuration file syntax, agent deployment complexity |
Moderate – Enterprise documentation, professional services available |
PRTG Network Monitor Keyboard Shortcuts
Web interface shortcuts enhance navigation speed, enabling rapid dashboard switching, alert acknowledgment, and sensor management without extensive mouse clicking. Consistent shortcut patterns align with enterprise application standards.
| Action |
Windows |
macOS |
| Open Dashboard Search |
Ctrl+/ |
Cmd+/ |
| Toggle Sidebar Menu |
Ctrl+B |
Cmd+B |
| Refresh Current View |
Ctrl+R or F5 |
Cmd+R or F5 |
| Jump to Device List |
Ctrl+D |
Cmd+D |
| Open Settings Page |
Ctrl+, |
Cmd+, |
| Acknowledge Alert |
Ctrl+A |
Cmd+A |
| Switch Dark/Light Mode |
Ctrl+Shift+T |
Cmd+Shift+T |
| View Help Documentation |
Ctrl+H or F1 |
Cmd+H or F1 |
PRTG Network Monitor Performance Optimization
Strategic sensor configuration, intelligent alert thresholding, and resource allocation maximizes PRTG performance across monitoring scales from 100 to 50,000 sensors. Optimization reduces false alerts and improves dashboard responsiveness.
- Optimize Sensor Scanning Intervals – Balance monitoring frequency with system load by increasing scan intervals (5-10 minutes) for non-critical metrics, reserving 1-minute intervals for critical services. 30-second intervals appropriate only for high-importance systems.
- Configure Intelligent Thresholds – Establish baseline-aware alert thresholds using historical data rather than static values. Dynamic thresholds reduce false positives by 70-80%, decreasing alert fatigue and improving actual incident detection rates.
- Implement Sensor Inheritance – Leverage PRTG’s tree hierarchy inheritance to apply global settings, update intervals, and notification rules across device groups without individual configuration, reducing administrative overhead.
- Utilize Remote Probes Strategically – Deploy multi-platform probes near monitoring targets to reduce WAN traffic, distribute processing load, and improve response times by 40-60% in geographically distributed networks.
- Archive Historical Data Regularly – Configure automatic data retention policies, archiving older records to external storage while maintaining recent data for trending analysis and compliance reporting requirements.
PRTG Network Monitor Accessibility Features
PRTG web interface implements WCAG 2.1 accessibility standards supporting screen readers, keyboard navigation, and high-contrast modes. Responsive design supports tablet and mobile access for remote monitoring scenarios.
- Screen Reader Support – AJAX-based interface supports JAWS and NVDA with proper ARIA labels for dashboard widgets, sensor tables, and alert lists. Status messages announced to screen readers ensure immediate awareness of system changes.
- Visual Accessibility – High-contrast theme option improves visibility for low-vision users; configurable font sizes accommodate various visual acuity levels; color-independent alert indicators (icons + text) avoid reliance on hue alone.
- Keyboard Navigation – Complete keyboard-only navigation throughout web interface via Tab order, Enter key activation, and arrow keys for list navigation. All functions accessible without mouse interaction.
- Multilingual Support – Interface available in German, Spanish, French, Portuguese, Russian, Chinese, Japanese, and Dutch with appropriate RTL support for applicable languages and localized date/time formatting.
PRTG Network Monitor Support & Documentation
Paessler maintains comprehensive documentation, active community forums, and professional support options. Extensive knowledge base, video tutorials, and webinar training ensure successful deployment and ongoing optimization.
- Official Documentation – Complete PRTG manual covering installation, sensor configuration, alerting setup, API documentation, and troubleshooting guides. Regular updates reflect latest version features and best practices for enterprise deployments.
- Community Forum – Paessler-moderated discussion forums host thousands of questions from users and solutions shared by power users and Paessler engineers. Dedicated threads for feature requests track community-requested enhancements.
- Video Tutorials – Paessler YouTube channel offers setup guides, sensor configuration walkthroughs, and advanced monitoring strategies. Third-party trainers provide certifications and specialized training for IT teams.
- Professional Support – Paessler offers commercial support contracts for mission-critical deployments, on-site installation assistance, and custom sensor development. Support portal tracks incidents and provides status updates for urgent issues.