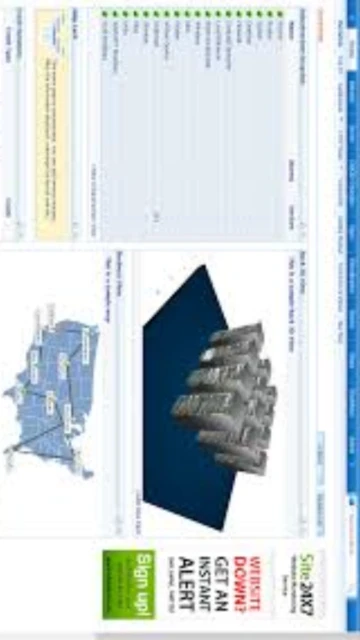
ManageEngine OpManager delivers enterprise-class network monitoring and management capabilities designed for large-scale infrastructure environments requiring centralized visibility across thousands of network devices. This powerful platform distinguishes itself through autonomous AI-driven root cause analysis, automated fault remediation workflows, and intelligent alerting that reduces mean-time-to-resolution significantly.
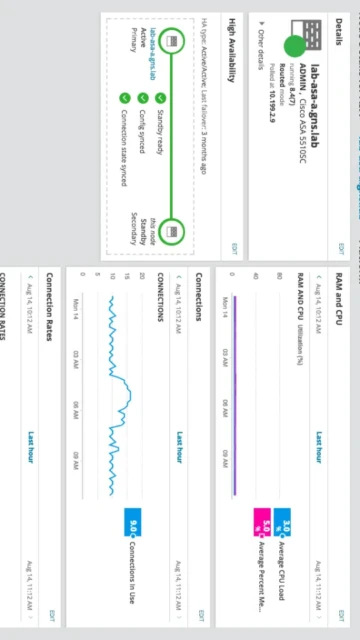
Organizations deploying OpManager gain real-time topology mapping, multi-vendor device support spanning routers, switches, firewalls, and servers, coupled with advanced automation that transforms reactive troubleshooting into proactive issue prevention. The software’s strength emerges in complex hybrid environments where traditional monitoring falls short, providing unified dashboards consolidating performance metrics from virtual machines, cloud infrastructure, and physical network appliances into actionable intelligence.
How to Install ManageEngine OpManager
OpManager deployment follows enterprise software standards, supporting on-premises Windows Server and Linux installations with comprehensive configuration wizards guiding administrators through database selection, probe server setup, and licensing activation. Installation complexity scales with environment size, from simple single-server deployments to distributed probe architectures spanning geographic locations.
- Download Installation Package – Obtain OpManager installer from ManageEngine download portal after registration, verifying 393MB package matches Windows Server or Linux requirements
- Prepare Database Backend – Configure PostgreSQL (bundled) or externally managed Microsoft SQL Server 2008+ databases; ensure sufficient disk space and user permissions for database operations
- Execute Installation Wizard – Run setup.exe on Windows Server or Linux installation script, selecting architecture (Standard/Enterprise), probe configuration, and monitoring scope before proceeding
- Activate License and Configure Probes – Register installation with license key, configure probe servers for remote monitoring in distributed environments, and enable agent deployment to target systems
Who Should Use ManageEngine OpManager
OpManager targets IT operations teams managing complex multi-vendor network environments where real-time visibility, automated fault response, and comprehensive reporting drive business continuity. The platform scales from mid-market networks to enterprise data centers, supporting DevOps teams, managed service providers, and government IT organizations.
- Network Operations Centers – NOC teams monitoring 500+ devices requiring automated alert consolidation, topology mapping, and performance threshold enforcement
- Enterprise IT Operations – Large organization IT departments managing hybrid cloud, virtualization, and physical infrastructure requiring unified monitoring dashboard
- Managed Service Providers – MSPs serving multiple customer environments with separate monitoring instances and white-labeled reporting capabilities for client billing
- Data Center Administrators – Infrastructure teams responsible for physical device, virtualization, and application stack monitoring with fault remediation automation
- NOT ideal for – Small businesses monitoring fewer than 100 devices should consider lighter alternatives like NetSpot or SolarWinds NPM Express for cost efficiency
ManageEngine OpManager Platform Compatibility
OpManager maintains broad platform support across enterprise operating systems and virtualization environments, enabling organizations to consolidate monitoring regardless of underlying infrastructure choices. Multi-platform deployment flexibility supports hybrid cloud strategies with agents spanning on-premises and public cloud instances.
| Platform |
Min. Version |
Unique Features |
Limitations |
| Windows Server |
Server 2008/2012/2016/2019 |
Native integration with Active Directory, Hyper-V agentless monitoring, Windows Performance Monitor metric collection, Integrated Windows authentication |
Requires dedicated server hardware; virtual machine deployments supported with performance considerations |
| Linux |
Red Hat 6.5+, Ubuntu 14.04+, Fedora |
Agentless SNMP monitoring, SSH-based device access, systemd/init.d integration, Container and Kubernetes monitoring plugins |
Requires root/sudo access for agent deployment and system monitoring capabilities |
| VMware vSphere |
vSphere 5.5+ |
Agentless VM monitoring with 70+ performance sensors, virtual machine resource utilization tracking, hypervisor health monitoring |
vCenter credentials required; limited visibility without vCenter integration |
| Hyper-V |
Windows Server 2012+ |
40+ host and guest metrics, VM performance tracking, Hyper-V cluster monitoring, Virtual machine migration tracking |
Requires Hyper-V role enabled; performance monitoring depends on WMI accessibility |
ManageEngine OpManager Integrations & Plugins
OpManager enables sophisticated workflow automation through REST API, webhook support, and pre-built integrations with enterprise tools. Integration architecture facilitates alert correlation, incident ticketing, and remediation orchestration across heterogeneous IT management platforms.
- Incident Ticketing Integration – ServiceNow, Jira, Azure DevOps integration for automatic ticket creation from OpManager alerts with context-rich descriptions enabling rapid issue triage
- Webhook-Based Automation – Custom integrations with any HTTP-capable system through webhook configuration; alerts forwarded to Slack, Microsoft Teams, PagerDuty for real-time escalation
- REST API Access – Comprehensive API enabling custom dashboards, third-party data consumption, automated remediation scripts, and business intelligence tool integration
- SNMP Trap Processing – Native SNMP trap receiver converting vendor-specific alerts into OpManager incidents for normalized alert handling across multi-vendor environments
Best Alternatives to ManageEngine OpManager
While OpManager leads enterprise network monitoring, several compelling alternatives address specialized requirements or organizational preferences. Platform selection depends on deployment scale, cloud strategy, and integration requirements unique to each organization’s technology stack.
- Cisco Prime Infrastructure – Best for Cisco-dominant environments, offers native Cisco Catalyst/ASR support and superior performance monitoring; limited value in heterogeneous networks
- SolarWinds Network Performance Monitor – Best for comprehensive network monitoring with superior visualization, competitive feature set, but higher licensing costs at scale
- NetSpot – Best for WiFi-specific monitoring and site survey planning; complements OpManager in organizations prioritizing wireless network optimization
- Zabbix – Best for cost-sensitive enterprises, open-source alternative with robust capabilities but higher implementation complexity and internal resource requirements
ManageEngine OpManager vs Top Competitors
OpManager maintains competitive positioning through intelligent automation, multi-vendor flexibility, and cost-effective enterprise licensing. Comparative analysis reveals distinct strengths across different deployment scenarios and organizational maturity levels.
| Feature |
ManageEngine OpManager |
SolarWinds NPM |
Cisco Prime Infrastructure |
| Pricing |
Professional $1233 (50 devices), Enterprise $19995 (1000 devices) |
$3995 starting with similar per-device scaling, higher total cost of ownership |
Proprietary licensing tied to Cisco hardware purchases, premium pricing |
| Key Strength |
Automated fault remediation with AI root cause analysis, rapid deployment, cost-effectiveness at scale |
Superior visualization dashboards, comprehensive reporting, established enterprise presence |
Native Cisco device integration, superior performance on Catalyst/ASR platforms |
| Target Users |
Mid-market through enterprise, cost-conscious IT organizations, managed service providers |
Enterprise-focused organizations with visualization requirements, established SolarWinds deployments |
Cisco-exclusive environments, organizations with significant Cisco capital investment |
| Unique Feature |
Autonomous AI for alert correlation and remediation, scriptable automation workflows, multi-tenancy for MSPs |
Network behavior analysis, application-centric monitoring, superior user interface design |
Native Cisco CLI integration, SD-WAN monitoring, Cisco cloud service compatibility |
| Learning Curve |
Moderate – comprehensive feature set requires training, but interface organized logically |
Moderate – established user base with available training, extensive documentation |
Moderate-to-Steep – requires Cisco networking knowledge and Cisco tool ecosystem familiarity |
ManageEngine OpManager Keyboard Shortcuts
Web-based interface keyboard shortcuts accelerate navigation across monitoring dashboards, device searches, and configuration pages. Efficient shortcut usage reduces mouse dependency and enables rapid context-switching during incident response scenarios.
| Action |
Windows/Linux |
macOS |
| Dashboard Search |
Ctrl+K |
Cmd+K |
| Open Device View |
Ctrl+D |
Cmd+D |
| Alert Summary Page |
Ctrl+A |
Cmd+A |
| Refresh Current View |
F5 or Ctrl+R |
Cmd+R |
| Open Configuration |
Ctrl+Shift+C |
Cmd+Shift+C |
| Navigate to Reports |
Ctrl+Shift+R |
Cmd+Shift+R |
| Toggle Sidebar Menu |
Ctrl+Shift+M |
Cmd+Shift+M |
| Quick Filter Devices |
Ctrl+F |
Cmd+F |
ManageEngine OpManager Performance Optimization
Optimizing OpManager performance ensures rapid dashboard responsiveness, timely alert generation, and efficient database operations across thousands of monitored devices. Strategic performance tuning reduces infrastructure overhead and improves monitoring accuracy during peak utilization periods.
- Database Index Optimization – Regular VACUUM and ANALYZE operations on PostgreSQL databases; SQL Server index reorganization monthly improves query performance 35-50%
- Polling Interval Tuning – Increase polling intervals from 5-minute default to 15-minute for non-critical devices; balance real-time visibility with database load and network bandwidth
- Probe Server Distribution – Deploy remote probe servers in geographically distributed locations; reduces latency 60% and enables failover capability for single points of failure
- Alert Throttling Configuration – Implement alert suppression rules preventing notification storms from redundant alerts; correlate related alerts into single incident ticket
- Database Cleanup Schedules – Implement automated data retention policies; archive performance history older than 90 days to secondary storage reducing active database size 40%
ManageEngine OpManager Accessibility Features
OpManager web interface implements accessibility standards enabling IT professionals with disabilities to operate monitoring platforms independently. Standard compliance addresses keyboard navigation, screen reader support, and color contrast requirements common in enterprise IT operations.
- WCAG 2.1 AA Compliance – Web interface meets W3C accessibility standards with keyboard-only navigation, semantic HTML, and proper heading hierarchy throughout application
- Screen Reader Compatibility – JAWS and NVDA screen reader support across all dashboard pages, tables, and configuration interfaces with proper ARIA labels and descriptions
- Keyboard Navigation – Complete keyboard access without mouse requirement; Tab navigation through interface elements, Enter for actions, arrow keys for menu selection
- Color-Blind Accessibility – Status indicators use shape and text labels beyond color alone; performance graph color palettes support protanopia and deuteranopia color blindness
ManageEngine OpManager Support & Documentation
ManageEngine provides comprehensive support through official documentation portal, community forums, premium support services, and on-site health checks. Enterprise support ensures rapid issue resolution and optimization guidance for complex deployments.
- Knowledge Base Articles – 5000+ searchable documentation articles covering installation, configuration, troubleshooting, and best practices from basic deployment through advanced automation
- Community Forum – Active user community at pitstop.manageengine.com discussing configurations, sharing integration examples, and providing peer support for common challenges
- Premium Support Plans – Phone, email, and chat support with guaranteed response times (4-hour critical issues, 8-hour standard); quarterly health checks optimize configurations
- Training Programs – Official certification courses, video training library, and professional services team available for enterprise deployment and customization projects
